When I was working with couple of
frequent blocking issue in our production servers, I have noticed different
types of wait resources which are very common and can be very useful but people
often overlooked these while troubleshooting. I also feel that "wait
stats" is one of the most under-utilized performance troubleshooting
methodologies in the SQL Server.
Any time a user connection is waiting,
SQL Server keep track of wait time. For example, the application requests
resources such as I/O, locks, or memory and can wait for the resource to be
available.
There are few system wait types which
are always present and there are a few wait types which can really cause a
heavy bottleneck for your system.
Types of Waits
As per BOL, there are three types of
wait types, namely:
Resource waits
Resource waits occur when a worker requests access
to a resource that is not available because the resource is being used by some
other worker or is not yet available. Examples of resource waits are locks,
latches, network and disk I/O waits. Lock and latch waits are waits on
synchronization objects
Queue waits
Queue waits occur when a worker is idle, waiting
for work to be assigned. Queue waits are most typically seen with system
background tasks such as the deadlock monitor and deleted record cleanup tasks.
These tasks will wait for work requests to be placed into a work queue. Queue
waits may also periodically become active even if no new packets have been put
on the queue.
External waits
External waits occur when a SQL Server worker is
waiting for an external event, such as an extended stored procedure call or a
linked server query, to finish. When you diagnose blocking issues, remember
that external waits do not always imply that the worker is idle, because the
worker may actively be running some external code.
To check the wait types for any server,
just run the following simple T-SQL:
SELECT * FROM sys.dm_os_wait_stats
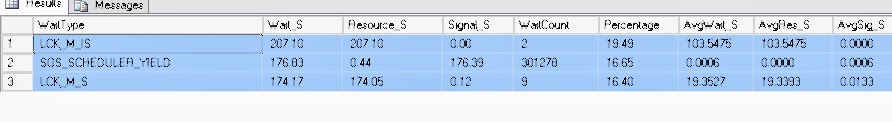
Along with above thoughts ,
it woold be good to extract useful information from below T-SQL. This will show
the waits grouped together as a percentage of all waits on the system, in
decreasing order. The waits to be concerned about (potentially) are those at
the top of the list as this represents the majority of where SQL Server is
spending it’s time waiting.
This code
based on a query written by MVP Glenn Berry and modified by Paul S. Randal so credit goes to them.
----------------------------------------------------------------
WITH [Waits]
AS
(SELECT
[wait_type],
[wait_time_ms]
/ 1000.0 AS [WaitS],
([wait_time_ms] - [signal_wait_time_ms])
/ 1000.0 AS [ResourceS],
[signal_wait_time_ms]
/ 1000.0 AS [SignalS],
[waiting_tasks_count]
AS [WaitCount],
100.0 *
[wait_time_ms] /
SUM ([wait_time_ms]) OVER() AS [Percentage],
ROW_NUMBER() OVER(ORDER BY [wait_time_ms] DESC) AS [RowNum]
FROM sys.dm_os_wait_stats
WHERE [wait_type]
NOT IN (
N'CLR_SEMAPHORE', N'LAZYWRITER_SLEEP',
N'RESOURCE_QUEUE', N'SQLTRACE_BUFFER_FLUSH',
N'SLEEP_TASK', N'SLEEP_SYSTEMTASK',
N'WAITFOR', N'HADR_FILESTREAM_IOMGR_IOCOMPLETION',
N'CHECKPOINT_QUEUE', N'REQUEST_FOR_DEADLOCK_SEARCH',
N'XE_TIMER_EVENT', N'XE_DISPATCHER_JOIN',
N'LOGMGR_QUEUE', N'FT_IFTS_SCHEDULER_IDLE_WAIT',
N'BROKER_TASK_STOP', N'CLR_MANUAL_EVENT',
N'CLR_AUTO_EVENT', N'DISPATCHER_QUEUE_SEMAPHORE',
N'TRACEWRITE', N'XE_DISPATCHER_WAIT',
N'BROKER_TO_FLUSH', N'BROKER_EVENTHANDLER',
N'FT_IFTSHC_MUTEX', N'SQLTRACE_INCREMENTAL_FLUSH_SLEEP',
N'DIRTY_PAGE_POLL', N'SP_SERVER_DIAGNOSTICS_SLEEP')
)
SELECT
[W1].[wait_type] AS [WaitType],
CAST ([W1].[WaitS] AS DECIMAL(14, 2)) AS [Wait_S],
CAST ([W1].[ResourceS] AS DECIMAL(14, 2)) AS [Resource_S],
CAST ([W1].[SignalS] AS DECIMAL(14, 2)) AS [Signal_S],
[W1].[WaitCount] AS [WaitCount],
CAST ([W1].[Percentage] AS DECIMAL(4, 2)) AS [Percentage],
CAST (([W1].[WaitS] / [W1].[WaitCount]) AS DECIMAL (14, 4)) AS [AvgWait_S],
CAST (([W1].[ResourceS] / [W1].[WaitCount]) AS DECIMAL (14, 4)) AS [AvgRes_S],
CAST (([W1].[SignalS] / [W1].[WaitCount]) AS DECIMAL (14, 4)) AS [AvgSig_S]
FROM [Waits]
AS [W1]
INNER JOIN
[Waits] AS [W2]
ON [W2].[RowNum] <= [W1].[RowNum]
GROUP BY
[W1].[RowNum], [W1].[wait_type], [W1].[WaitS],
[W1].[ResourceS], [W1].[SignalS], [W1].[WaitCount], [W1].[Percentage]
HAVING SUM ([W2].[Percentage]) - [W1].[Percentage] < 95; -- percentage threshold
GO
Output: Will be
something like as mentioned below:
Brgds,
Chhavinath Mishra
Sr. Database
Administrator
No comments:
Post a Comment